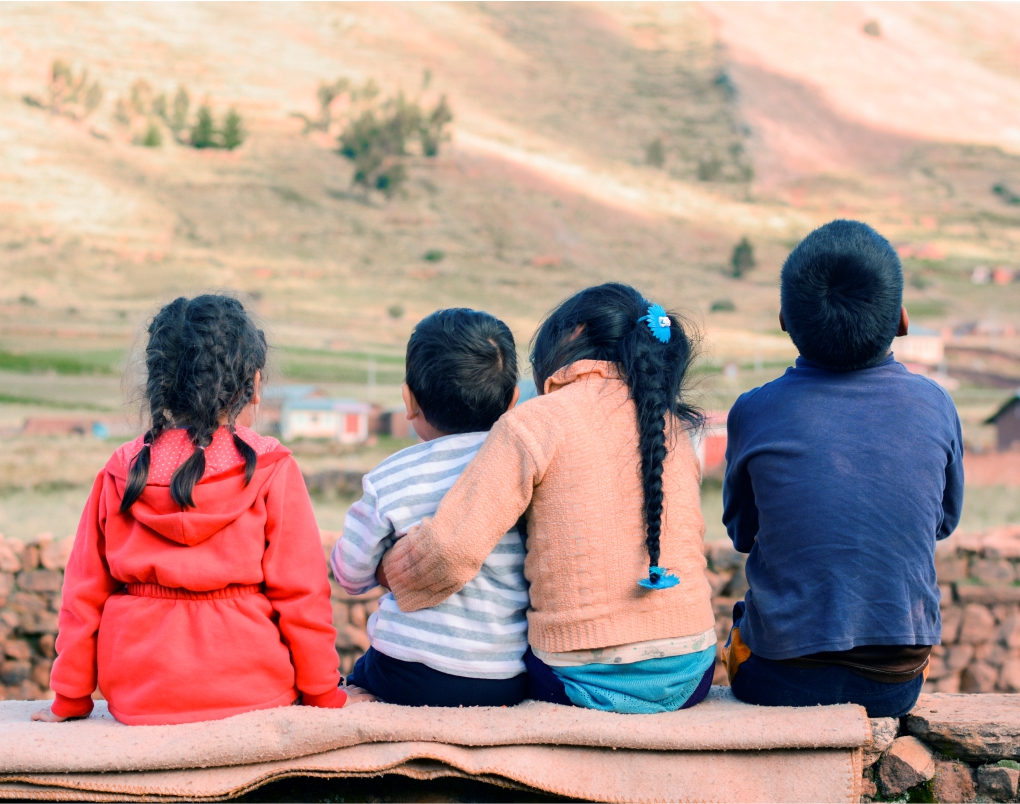
Childhood and youth

This section contains the indicators about schooling and development during childhood, adolescence, and youth of the GenLAC database. Indicators are available by gender and educational level. They are constructed based on microdata from household surveys and standardized tests PISA (OECD) and ERCE (UNESCO). In future steps, other sources of data will be included, such as demographic and health surveys.

Indicators

Schooling

Percentage of five-year-old children enrolled in an educational institution.

Indicator available by gender (women and men), and educational level of the household* (high school dropouts, high school graduates or some college, higher education completed).

(*) The household’s educational level is the highest educational level between household head and spouse.

Source: constructed based on Household Surveys.

icono ExcelDownload

icono DTADownload

Percentage of 3-5 year-old children enrolled in an educational institution.

Indicator available by gender (women and men), and educational level of the household* (high school dropouts, high school graduates or some college, higher education completed).

(*) The household’s educational level is the highest educational level between household head and spouse.

Source: constructed based on Household Surveys.

icono ExcelDownload

icono DTADownload

Individuals enrolled in primary education as a percentage of primary school age population.

Indicator available by gender (women and men), and educational level of the household* (high school dropouts, high school graduates or some college, higher education completed).

(*) The household’s educational level is the highest educational level between household head and spouse.

Source: constructed based on Household Surveys.

icono ExcelDownload

icono DTADownload

Individuals enrolled in secondary education as a percentage of secondary school age population.

Indicator available by gender (women and men), and educational level of the household* (high school dropouts, high school graduates or some college, higher education completed).

(*) The household’s educational level is the highest educational level between household head and spouse.

Source: constructed based on Household Surveys.

icono ExcelDownload

icono DTADownload

Individuals enrolled in tertiary education as a percentage of tertiary school age population.

Indicator available by gender (women and men).

Source: constructed based on Household Surveys.

icono ExcelDownload

icono DTADownload

Percentage of children aged 3-5 years above the theoretical age for the last grade of primary education who have completed primary school.

Indicator available by gender (women and men), and educational level of the household* (high school dropouts, high school graduates or some college, higher education completed).

(*) The household’s educational level is the highest educational level between household head and spouse.

Source: constructed based on Household Surveys.

icono ExcelDownload

icono DTADownload

Percentage of youth aged 3-5 years above the theoretical age for the last grade of secondary education who have completed secondary school.

Indicator available by gender (women and men).

Source: constructed based on Household Surveys.

icono ExcelDownload

icono DTADownload

Includes all the indicators in the Schooling sub-category

icono ExcelDownload

icono DTADownload

Activities and time use

Percentage of individuals aged 15-24 who dedicate time to children and other household members’ care, in households with children aged 0-14.

Indicator available by gender (women and men).

Source: constructed based on Time Use Surveys.

icono ExcelDownload

icono DTADownload

Weekly hours allocated to children and other household members’ care, including exclusive and non-exclusive time. The reference population includes people aged 15-24 in households with children aged 0-14.

Indicator available by gender (women and men).

Source: constructed based on Time Use Surveys.

icono ExcelDownload

icono DTADownload

Percentage of individuals aged 15-24 who dedicate time to childcare, in households with children aged 0-14.

Indicator available by gender (women and men).

Source: constructed based on Time Use Surveys.

icono ExcelDownload

icono DTADownload

Weekly hours allocated to childcare, including exclusive and non-exclusive time. The reference population includes people aged 15-24 in households with children aged 0-14.

Indicator available by gender (women and men).

Source: constructed based on Time Use Surveys.

icono ExcelDownload

icono DTADownload

Percentage of youth aged 15-24 who are neither in school, nor employed or looking for work.

Indicator available by gender (women and men).

Source: constructed based on Household Surveys.

icono ExcelDownload

icono DTADownload

Includes all the indicators in the Activities and Time Use  sub-category

icono ExcelDownload

icono DTADownload

Test Scores

Average score in standardized tests for students in 3rd grade.

Indicator available by subject (math and language), gender (women and men), and educational level of the household (*).

(*) The household’s educational level is the highest educational level held between father and mother.

Source: constructed based on ERCE (UNESCO).

icono ExcelDownload

icono DTADownload

Average score in standardized tests for students in 6th grade.

Indicator available by subject (math, language, and science), gender (women and men), and educational level of the household (*).

(*) The household’s educational level is the highest educational level held between father and mother.

Source: constructed based on ERCE (UNESCO).

icono ExcelDownload

icono DTADownload

Average score in standardized tests for students aged 15 years old.

Indicator available by subject (math, language, and science), gender (women and men), and educational level of the household (*).

(*) The household’s educational level is the highest educational level held between father and mother.

Source: constructed based on PISA (OECD).

icono ExcelDownload

icono DTADownload

Ratio of standardized tests scores between girls and boys in 3rd grade.

Indicator available by subject (math and language), and educational level of the household (*).

(*) The household’s educational level is the highest educational level held between father and mother.

Source: constructed based on ERCE (UNESCO).

icono ExcelDownload

icono DTADownload

Ratio of standardized tests scores between girls and boys in 6th grade.

Indicator available by subject (math, language, and science), and educational level of the household (*).

(*) The household’s educational level is the highest educational level held between father and mother.

Source: constructed based on ERCE (UNESCO).

icono ExcelDownload

icono DTADownload

Ratio of standardized tests scores between female and male students aged 15.

Indicator available by subject (math, language, and science), and educational level of the household (*).

(*) The household’s educational level is the highest educational level held between father and mother.

Source: constructed based on PISA (OECD).

icono ExcelDownload

icono DTADownload

Percentage of students in the bottom 10% of the standardized test scores distribution in 3rd grade who are women.

Indicator available by subject (math and language) and educational level of the household (*).

(*) The household’s educational level is the highest educational level held between father and mother.

Source: constructed based on ERCE (UNESCO).

icono ExcelDownload

icono DTADownload

Percentage of students in the bottom 10% of the standardized test scores distribution in 6th grade who are women.

Indicator available by subject (math, language, science), and educational level of the household (*).

(*) The household’s educational level is the highest educational level held between father and mother.

Source: constructed based on ERCE (UNESCO).

icono ExcelDownload

icono DTADownload

Percentage of students in the bottom 10% of the standardized test scores distribution for 15 year-old students who are women.

Indicator available by subject (math, language, science), and educational level of the household (*).

(*) The household’s educational level is the highest educational level held between father and mother.

Source: constructed based on PISA (OECD).

icono ExcelDownload

icono DTADownload

Percentage of students in the top 10% of the standardized test scores distribution in 3rd grade who are women.

Indicator available by subject (math and language), and educational level of the household (*).

(*) The household’s educational level is the highest educational level held between father and mother.

Source: constructed based on ERCE (UNESCO).

icono ExcelDownload

icono DTADownload

Percentage of students in the top 10% of the standardized test scores distribution in 6th grade who are women.

Indicator available by subject (math, language, science), and educational level of the household (*).

(*) The household’s educational level is the highest educational level held between father and mother.

Source: constructed based on ERCE (UNESCO).

icono ExcelDownload

icono DTADownload

Percentage of students in the top 10% of the standardized test scores distribution for 15 year-old students who are women.

Indicator available by subject (math, language, science), and educational level of the household (*).

(*) The household’s educational level is the highest educational level held between father and mother.

Source: constructed based on PISA (OECD).

icono ExcelDownload

icono DTADownload

Percentage of 15 year-old functionally illiterate students who are women. Functionally illiterate students are those who do not reach proficiency level 2 in standardized test scores. For more detail, visit https://www.oecd.org/pisa/.

Indicator available by subject (math, language, science) and educational level of the household (*).

(*) The household’s educational level is the highest educational level held between father and mother.

Source: constructed based on PISA (OECD).

icono ExcelDownload

icono DTADownload

Includes all the indicators in the Test score sub-category.

icono ExcelDownload

icono DTADownload

Non-cognitive abilities

Percentage of 6th grade students responding always/almost always or several times to ‘I follow class rules and regulations.’

Indicator available by gender (women and men).

Source: constructed based on ERCE (UNESCO).

icono ExcelDownload

icono DTADownload

Percentage of 6th grade students responding always/almost always or several times to ‘I ask the teacher for help when I don’t understand what to do.’

Indicator available by gender (women and men).

Source: constructed based on ERCE (UNESCO).

icono ExcelDownload

icono DTADownload

Percentage of 6th grade students responding always/almost always or several times to ‘Before turning in an assignment or test I check it well.’

Indicator available by gender (women and men).

Source: constructed based on ERCE (UNESCO).

icono ExcelDownload

icono DTADownload

Percentage of 6th grade students responding always/almost always or several times to ‘I wait for my turn to speak in class.’

Indicator available by gender (women and men).

Source: constructed based on ERCE (UNESCO).

icono ExcelDownload

icono DTADownload

Percentage of 6th grade students responding always/almost always or several times to ‘Even if things don’t work out for me, I keep trying’.

Indicator available by gender (women and men).

Source: constructed based on ERCE (UNESCO).

icono ExcelDownload

icono DTADownload

Average self-regulation index for sixth grade students. See variables dictionary for more details.

Indicator available by gender (women and men).

Source: constructed based on ERCE (UNESCO).

icono ExcelDownload

icono DTADownload

Includes all the indicators in the Non-cognitive abilities sub-category.

icono ExcelDownload

icono DTADownload

All indicators about Childhood and Youth

Cite the GenLAC database

Information taken from this database should be cited as “Source: GenLAC (CEDLAS)” or “Source: GenLAC – Evidence for gender equity in Latin America and the Caribbean (CEDLAS)”. The APA style citation is available below. We advise that users reference the date that the database was consulted.

CEDLAS (2023). GenLAC – Evidence for gender equity in Latin America and the Caribbean (Version 3.1) [database]. Retrieved from https://genlac.econo.unlp.edu.ar/en

@misc{genlac_es,
author = {{CEDLAS}},
title = {GenLAC – Evidence for gender equity in Latin {A}merica and the {C}aribbean (Version 3.1). [database]},
year = {2023},
note = {Retrieved from \url{https://genlac.econo.unlp.edu.ar/en}},
}

GenLAC employment, wages and education indicators are constructed following the processing protocol of the SEDLAC project (CEDLAS and The World Bank).

We would appreciate a copy of any publications or reports in which the GenLAC database is used is sent to GenLAC@econo.unlp.edu.ar.

Explore the data

We expect to gradually incorporate non-binary gender categories when information from official surveys is available.